We had a baby! Toby Lev Letourneau was born April 13th 2017, and he’s such a cool kid:


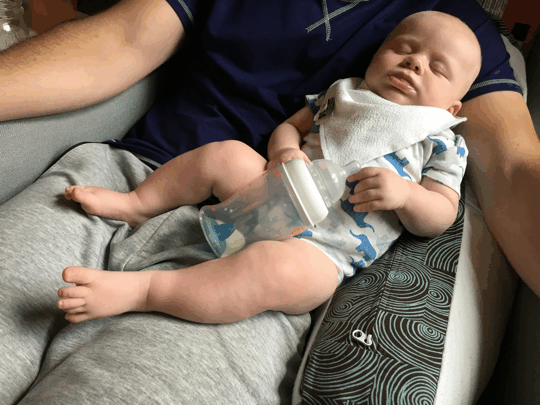
We’ve been tracking Toby’s bottle feedings using an app called BabyConnect since he was born. We track when we gave him a bottle and how much he ate. It’s been immediately useful to know exactly when we last fed him, since babies have to eat very frequently when they’re first born to maintain their blood sugars. We’ve seen the occasional food coma:

A nice side-effect of tracking Toby’s bottle feedings is the database we’ve created of his eating habits over time. Toby’s about 4 months old now, so we have about 4 months of data to show how his eating habits have progressed.
This goal of this post is to explore the data a bit!
I exported a CSV file from BabyConnect:

What are the headings in the data?


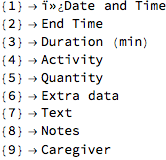
There are several types of activities we’ve been logging:


Right now I’m just interested in the “Bottle” activity, so I’ll filter for those entries:


It’s easier to see the structure of the data if I transpose it and view just a few entries:

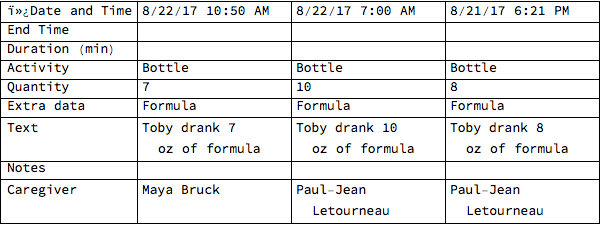
The fields I’m interested in are the date/time of the feeding, and how much Toby ate. So I’ll filter just those fields:


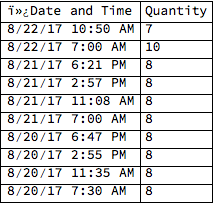
(There’s a character encoding issue evident in the “Date and Time” field, which I’ll ignore for now as long as it isn’t obviously effecting the data values.)
The data is in reverse-chronological order, and the “Quantity” field is in ounces.
In order to start analyzing this data, I need to parse the date field into a canonical format:


The quantity field has been parsed into numbers by the CSV importer:


Haha … we have been strangely specific about logging how much Toby’s eaten, down to the 0.05 ounce??? I doubt we’ve ever been able to discern 0.1 ounces from 0.15 ounces ;) We can maybe distinguish between 0.1 and 0.2 ounces? Anyway, I’ll take the precision with a grain of salt :)


Okay so I’m ready to parse the bottle feedings data:


Now the fun begins. The first thing I’d like to see is the bottle quantity as a function of time:

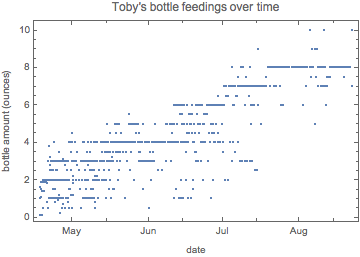
There’s a general trend towards larger bottle amounts per feeding as Toby has gotten older. That’s exactly what I expected, since as Toby has grown he’s been able to eat more and more in a sitting.
After Toby was about 6 weeks old, we started putting his feedings onto a schedule. The goal was to get Toby to the point that he could sleep through the night without waking up to eat. In order to do that, we followed a program that recommended a feeding schedule of eating every 4 hours during the day, and gradually decreasing the amount he ate in his night feedings. The idea is that the baby gets more and more of his daily calories during the day, and less and less during the night, until he no longer needs to wake up at night to eat.
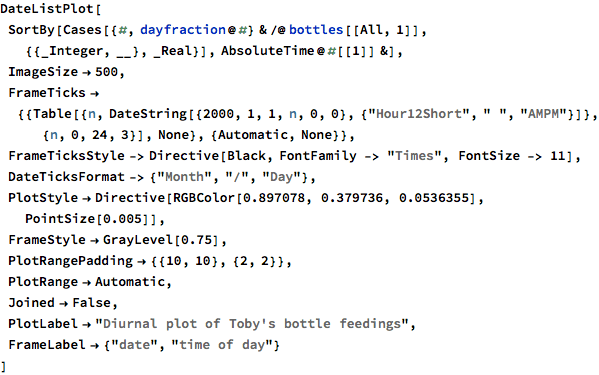
So I need to plot the feedings to show both the date and the time of day of the feeding. The best way to show that is with a diurnal plot, with the date on the x-axis, and the time of day on the y-axis:
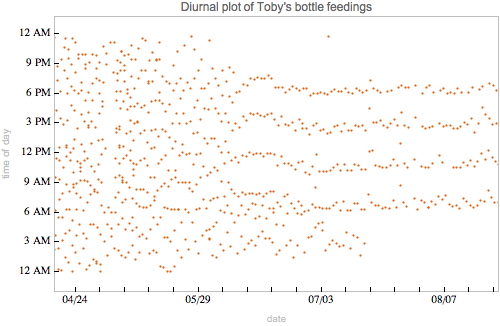
This shows really clearly the emergence of a feeding schedule for Toby. When Toby was first born, there was no schedule! He ate when he was hungry, which was every few hours, including in the middle of the night. But after a couple of months (around June), we started organizing his feedings into bands. He would eat when he woke up in the morning around 6 AM, then every 4 hours until he went to bed for the night around 6 PM.
Then around the middle of July, Toby stopped waking up at night to eat! Yay!!!!! We can sleep!!!!!
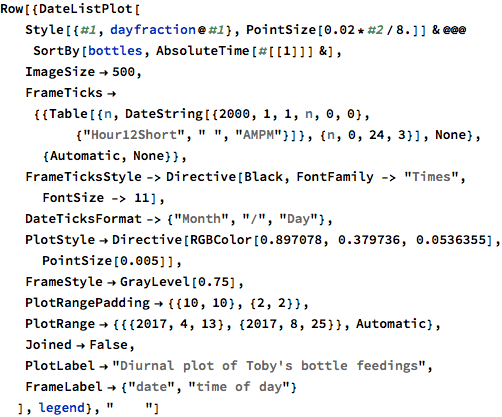
This diurnal plot is showing only the date and time of each feeding, but is still missing the amount he ate in each instance. I can modify the plot to show this by making the size of the point proportional to the amount he ate:


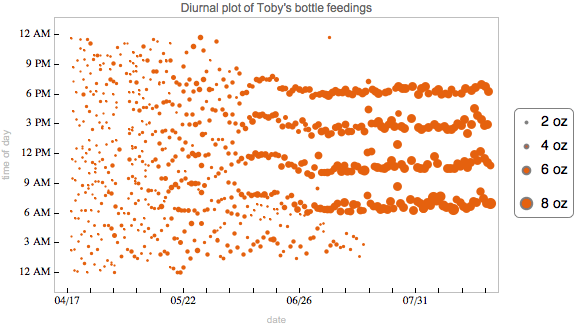
I love this plot! It shows a clear progression from little 1-2 oz meals at random times of the day, to larger 8 oz meals at consistent times of the day, about 4 hours apart. And can you imagine our relief when that little meal around 2 AM went away!? We could finally sleep through the night!
Toby sleeps like a champ now. He goes to bed around 7 PM and wakes up around 6 or 7 AM, giving us a blissful 11-12 hours to have dinner, catch up on our day, and get a full night’s sleep.

